view
- Visualization of data:
- ts : Interactive analysis of time-series data (1D and 3D).
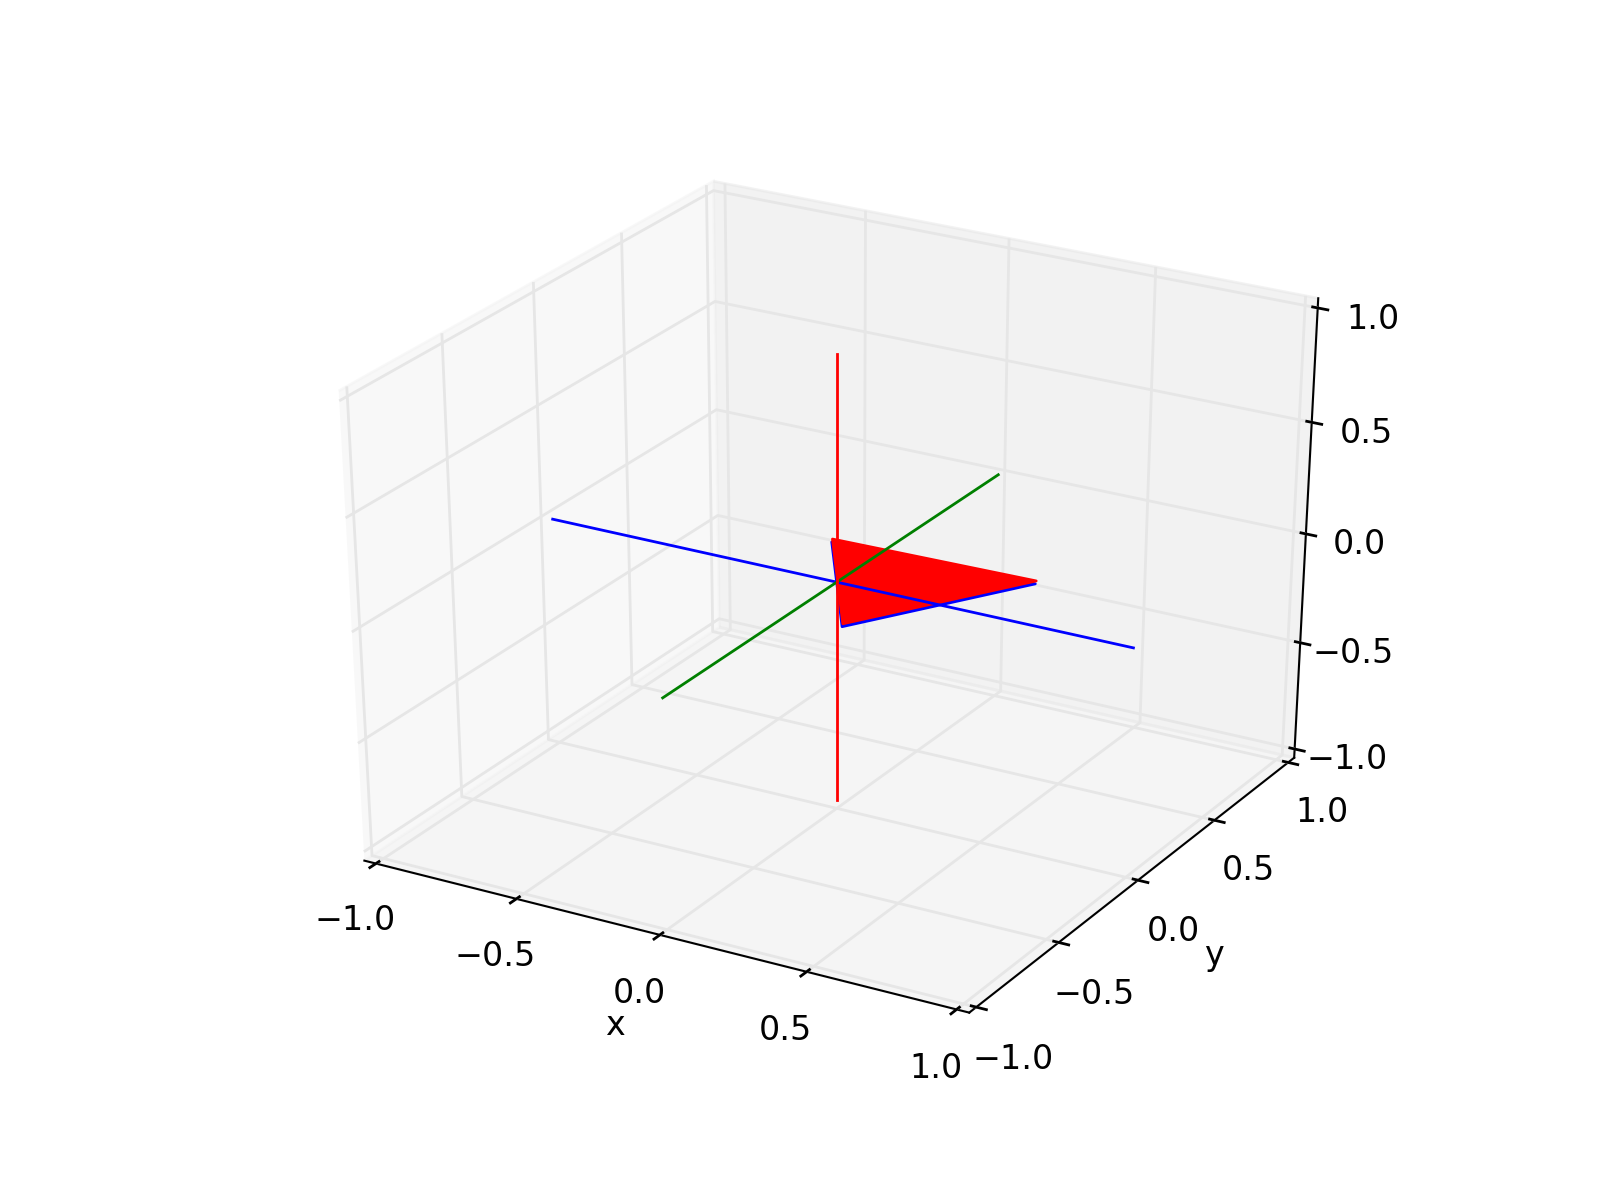
- orientation : Visualization of 3D orientations as animated triangle.
1-dimensional and 3-dimensional data can be viewed. It also allows to inspect the variables of the current workspace.
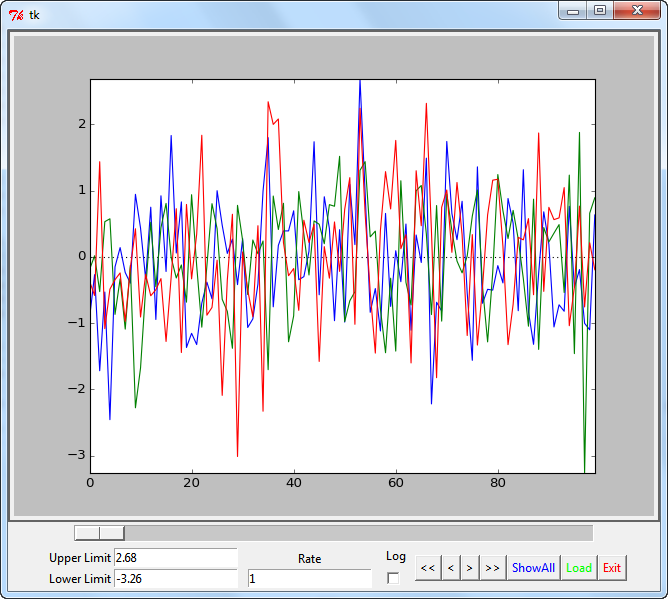
Interactively analyze time-series data ...
Functions
view.ts()... Viewer for time-series data

Improved viewability of 3D data.
view.orientation()... Visualize and animate orientations, expressed as quaternions.